What Your Java Code Does Between Compile and Run (And Why It Changed in 2026)
Published on 2026-07-19
A system-design walkthrough of the seven-stage JVM pipeline, anchored in ByteByteGo's EP211 and updated with 2026 OpenJDK changes: JEP 539 strict field initialization, the JDK 25 G1 silent-data-corruption bug, JDK 27's ramp, and GraalVM 25.1.
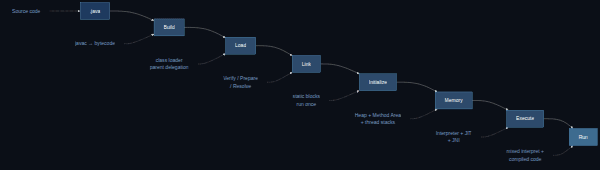
What Your Java Code Does Between Compile and Run (And Why It Changed in 2026)
ByteByteGo's EP211, published April 18, 2026, walks through a piece of code most engineers treat as a black box: the seven-stage path from a .java file to native instructions running on a CPU (ByteByteGo, EP211). The pipeline is the same one your production services have always used, and in 2026 the pipeline itself is being rewritten — a JEP that changes how initialization works, a JDK release with generational GC refinements around the corner, and a production-grade silent-data-corruption bug that should change what you pin today.
If you write or operate JVM services, you need to know this pipeline. Not because it changes every day, but because the decisions you make about which JDK to run and which GC to pick land directly on these stages.
The seven stages your code passes through
ByteByteGo frames it cleanly: Build → Load → Link → Initialize → Memory → Execute → Run. Most engineers skip the middle five.
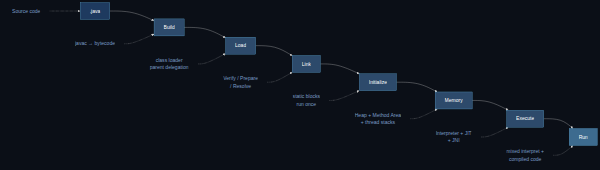
Each stage owns one decision:
- Build.
javacturns your source into platform-independent bytecode in.classfiles, JARs, or modules. - Load. The class loader subsystem fetches classes on demand using parent delegation. Bootstrap loads core JDK classes, Platform handles extensions, System loads your application.
- Link. Three substeps: Verify checks bytecode safety, Prepare allocates static fields with default values, Resolve turns symbolic references into direct memory addresses.
- Initialize. Static variables get their real values. Static initializer blocks run. Happens exactly once, the first time the class is used.
- Memory. Heap and Method Area are shared across threads. Each thread gets its own JVM stack, PC register, and native method stack. The garbage collector reclaims unused heap.
- Execute. The interpreter runs bytecode directly. Once a method gets called enough times, the JIT compiler converts it to native machine code and stashes it in the code cache. Native calls go through JNI to reach C/C++ libraries.
- Run. Your program runs on a mix of interpreted and JIT-compiled code. Fast startup, peak performance over time.
If you remember one thing: initialization happens exactly once, the verifier is a security boundary, and the JIT only kicks in after the interpreter pays a price. Everything else is detail.
Stage 1–3: Class loading and linking is your security boundary
The class loader hierarchy is not a curiosity. It is one of the most important security boundaries in the JVM, and ByteByteGo gets this right by leading with it.
Parent delegation means a class loader asks its parent first. System → Platform → Bootstrap. If a class is already loaded by the parent, the child uses that copy. If not, the parent tries, and only if every parent fails does the child loader try itself.
This ordering matters because it makes package access predictable. A class in java.lang can only come from the bootstrap loader. Your application code cannot redefine String to log every value passed through it, because the bootstrap loader resolves String first and the System loader never gets a vote.
The Verifier inside Link is the second security gate. Bytecode is not trusted when it enters the JVM. The verifier checks type safety, branch targets, and stack discipline before a class is allowed to run. This is why javac cannot ship malware: the bytecode shape it produces has to survive the verifier, and the verifier rejects shape-violating classes regardless of who wrote them.
Two practical implications:
- Class loader leaks (the dreaded
ClassCastException: ... are in unnamed module of loader ...) usually trace to a parent-delegation violation. The fix is almost always to use the loader hierarchy correctly, not to swap loaders. - Java 9's module system adds a layer above parent delegation.
module-info.javafiles declare which packages a module exports, andrequiresclauses declare dependencies. The module system is enforced by the same linkage stage — meaning the verifier now also checks module access rules.
Stage 4: Initialization runs once, and JEP 539 changes the contract
Initialization is the stage where static state actually becomes live. Before it runs, a class's static fields hold JVM defaults (0, null, false). After it runs, they hold whatever the static initializers and field initializers wrote.
Two things to know:
It happens exactly once. Every later use of the class reads initialized state. Multiple threads triggering initialization on an uninitialized class queue up; the JVM serializes them so only one initializer runs. This is why a slow static block can become a contention point at startup — every thread that hits a class needing initialization stalls behind the lock the JVM takes during <clinit>.
JEP 539 changes what "uninitialized" means. In July 2026, JEP 539 — Strict Field Initialization in the JVM (Preview) — was promoted to Candidate status (Java news roundup, 2026-07-17). Under the current contract, the verifier allows a read of a static field that has not yet been initialized; the value is whatever default the JVM assigns (0, null, false). JEP 539 introduces strictfp-style "strict fields" whose read-before-write is a verifier error rather than a silent default.
For most code, nothing changes. For libraries that depended on "zero is the right answer for an uninitialized counter" or "null is fine for an uninitialized map", JEP 539 forces those assumptions to be made explicit. The preview lands first in JDK 27's early-access builds; library maintainers should smoke-test against a JDK 27 early-access build with the JEP 539 preview enabled before the spec stabilizes.
Stage 5: Memory and the G1GC problem you should know about
The ByteByteGo piece keeps the memory section short: heap and Method Area are shared across threads; each thread gets its own JVM stack, PC register, and native method stack; the garbage collector reclaims heap.
That is the textbook. The 2026 reality is that the default garbage collector, G1, has a production-grade bug.
In July 2026, OpenJDK confirmed a silent data-corruption bug in JDK 25's G1GC implementation (JDK bug tracker). The bug corrupts heap state under specific write-barrier and concurrent-refinement interactions, and the corruption is not detected by the JVM — your application keeps running with the wrong data. The fix is queued for JDK 25.0.2 and JDK 26, with backport discussions for older LTS lines still open.
What this means in practice:
- If you are on JDK 25 with G1 (the default), upgrade to JDK 25.0.2 when it lands or switch to ZGC with
-XX:+UseZGC. - If you are on JDK 21 (the previous LTS), G1 has the same class of bugs fixed already, but watch the release notes carefully for any new ones backported.
- If you are on JDK 17 or older, you are out of vendor support for free patches. Plan a move.
The memory layout ByteByteGo describes has not changed, but the practical decision — which collector on which JDK — has.

Stage 6: Execute — interpreter, JIT, and where the speed comes from
ByteByteGo's coverage of Execute is the most useful section for engineers chasing latency.
The interpreter runs bytecode one instruction at a time. Slow, but startup-friendly: no compile step, no warmup. The JIT compiler watches method invocations and, once a method crosses a threshold, compiles it to native machine code and stores the result in the code cache. From that point on, the JVM calls the native version directly.
Modern OpenJDK uses Tiered Compilation by default, which combines two JIT compilers:
- C1 (Client Compiler): fast to compile, produces decent code, used for warm-up. Tier 1–3.
- C2 (Server Compiler): slow to compile, produces heavily optimized code using aggressive inlining, escape analysis, and loop transformations. Tier 4.
- C2 with profile data from C1: Tier 4 uses C1's profile counters to guide C2's optimizations. This is the secret sauce behind tiered compilation: cheap warm-up plus expensive peak.
A few production-relevant facts:
- On-Stack Replacement (OSR): when a long-running loop is still being interpreted or compiled by C1 while the surrounding code has already gone native, OSR rewrites the stack frame so the loop can jump into compiled code mid-execution. OSR is why "warm-up" can finish inside a single long loop instead of across many method calls.
- Code cache is finite. The total compiled-code footprint is bounded by
-XX:ReservedCodeCacheSize(default ~240MB on server JVMs). If your application compiles too many distinct methods, you hitCodeCache is fulland the JVM disables C2 — performance drops to interpreter-plus-C1 levels. Most apps never hit this; some Spring-heavy or dynamic-proxies-heavy services do. - JNI calls leave the JVM. A call into a native library through JNI pays a transition cost. Native calls also disable some GC optimizations and break some JIT inlining. JNI is necessary (it is how Netty, SSL, and most compression run) but it is not free.
To see JIT activity in production, add -XX:+UnlockDiagnosticVMOptions -XX:+PrintCompilation -XX:+LogCompilation and tail the hotspot.log file. It shows every method the JVM compiled, at which tier, and with what size. If a method you expected to be hot is missing from the log, the JVM has not profiled it the way you assumed.
Stage 7: Run — what the user actually feels
The Run stage is not a separate subsystem. It is the observable consequence of everything that came before. Two numbers tell almost the whole story:
- Time to First Transaction (TTFT): how long from process start until the first user request returns successfully. Driven by class loading, linking, initialization, and the cold-start path through the interpreter.
- Steady-state throughput: requests per second after the JIT has compiled hot methods and the GC has stabilized. Driven by the quality of C2 output and the GC's ability to keep heap occupancy predictable.
Three knobs move TTFT:
- AOT compilation. GraalVM Native Image and the (more limited) OpenJDK
jaotcship pre-compiled native binaries. Startup drops from seconds to tens of milliseconds. The trade-off: longer build times, restricted reflection, and harder debugging. GraalVM 25.1, released July 2026, cuts native-image binary size by 3% and adds G1 GC support for macOS AArch64 — incremental progress, not a breakthrough (GraalVM 25.1 release notes).
Three knobs move steady-state throughput:
- Tiered compilation tuning.
-XX:CompileThresholdcontrols when C1 hands off to C2. Lower values warm up faster but spend more time profiling; higher values are slower to peak but cheaper to get there. - GC choice. G1 is the default but, as noted, currently risky on JDK 25. ZGC is the low-pause alternative; generational ZGC (in JDK 21+) gives most of ZGC's pause-time benefits with better throughput for typical heaps.
- JVM ergonomics. Modern OpenJDK picks heap sizes, compiler threads, and GC threads automatically. For container deployments, set
-XX:MaxRAMPercentage=75(or another fixed percent) instead of letting the JVM guess fromcgroupmemory limits; the ergonomics are tuned for physical hardware.
What changed in 2026, and what to do this quarter
The pipeline is stable. The decisions you make on top of it are not.
The 2026 change log, in plain English:
| Item | Date | Status | Impact |
|---|---|---|---|
| JEP 539: Strict Field Initialization | July 2026 | Candidate (Preview) | Verifier rejects reads of uninitialized strict fields |
| JDK 25.0.2 (incl. G1 corruption fix) | Pending Q3 2026 | Pending | Pin or switch to ZGC |
| JDK 27 GA | September 2026 | Ramp | First release candidate for JEP 539 GA track |
| GraalVM 25.1 | July 2026 | Released | Native images 3% smaller, G1 on macOS AArch64 |
| JDK 28 expert group | July 2026 | Active | Proposals accepted for March 2027 release |
| Block monorepo migration (~450 JVM repos) | July 2026 | Reported | Confirms JVM fleets still scale in 2026 |
Your checklist for this quarter:
- Pin a JDK LTS. JDK 21 if you need stability today, JDK 25 only with
25.0.2+once the G1 fix ships. Avoid running an unsupported line in production. - Audit your GC choice. If you are on JDK 25 G1, either upgrade or move to ZGC. Document the choice in your service config so the next engineer does not have to reverse-engineer it.
- Smoke-test JEP 539. Run your libraries on a JDK 27 early-access build with the JEP 539 preview enabled (per the JEP text). Catch verifier errors before they hit production.
- Instrument JIT activity in one production environment. A 30-minute
LogCompilationcapture during peak load tells you which methods the JVM actually compiled. Most teams discover they have been tuning the wrong knob.
The JVM is not a black box, and it is not a museum piece. It is the runtime your services run on, and in 2026 it is being actively rewritten in ways that change what your code is allowed to assume. Treat it like the platform it is.